(This website uses Python code to show how to create a Mandelbrot fractal. It is designed to be somewhat easy to follow, however the code may have bad practices - most Mandelbrot fractals are created using low-level languages anyway, so other tutorials will likely give better results.)
Fractals are computer-generated images, that are made using specific formulas. The most well-known example is the Mandelbrot set, which is created using the formula z = z^2 + c. In this formula, c is the point on a canvas, such as (1.5, 1.3), and z is a point (for instance, (0, 0)), which is used as a start for the equation. To implement this in Python, the following code could be used:
        new_x = (x*x) - (y*y) + cx

        y = (2*x*y) + cy

        x = new_x
(If you have difficulty differentiating colours, you can hover over each part to see what colour it is.) In this code, you can see two parts, which have been coloured green and yellow. The green part is on the "real" plane, and the yellow part is on the "complex" plane. (The "c" stands for complex.) This links to the formula z = z^2 + c, and you can visually see how the equation has been translated into Python code. So, now that you have this formula, you may be wondering how it can be turned into an image. Well, for each point that you want to plot, you would plug it into the code, and run the code several times. If at any point x^2 + y^2 > 2*2, we can safely assume that the point is not a part of the Mandelbrot set, and it is coloured white. If the point always meets this criteria, it is a part of the Mandelbrot set, and will be coloured black. Python code for this is shown below:
BLACK = (0,0,0)
WHITE = (255,255,255)

zx = 0
zy = 0

def CheckMandelbrot(point: tuple):
    cx = point[0]
    cy = point[1]
    x = zx
    y = zy
    iteration = 0
    max_iterations = 25
    while(x*x + y*y <= 2*2 and iteration < max_iterations):
        new_x = (x*x) - (y*y) + cx
        y = (2*x*y) + cy
        x = new_x
        iteration += 1
    if(iteration == max_iterations):
        return(BLACK)
    else:
        return(WHITE)
from PIL import Image. Then, we will need some parameters to allow you to move the fractal around - notably, we will need a zoom, CANVAS_SIZE, offset_x, and offset_y. For zoom, set it to 0.125, for CANVAS_SIZE, set it to 500, and leave the offsets at 0. You should have these lines of code:
from PIL import Image
CANVAS_SIZE = 500

zoom = 0.125
offset_x = 0
offset_y = 0
def GenMandelbrotImage():
    pixels = []
    for ix in range(round(CANVAS_SIZE)):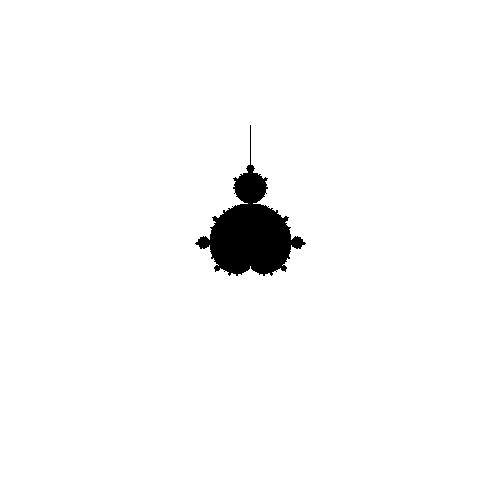
for iy in range(round(CANVAS_SIZE)):CheckMandelbrot() function from earlier, and it should visualise a Mandelbrot fractal, right? Well, as it turns out, the Mandelbrot fractal is actually really small - so, we will need to create some code to accomodate for that, and scale it up accordingly. the following line of code will upscale the fractal, using the zoom and CANVAS_SIZE variables we created earlier, alongside offset_x and offset_y to move it around: pixels.append(CheckMandelbrot((((ix+offset_x)/(CANVAS_SIZE*zoom)),(iy+offset_y)/(CANVAS_SIZE*zoom))))img = Image.new("RGB", (CANVAS_SIZE,CANVAS_SIZE))img.putdata(pixels), then we can save the image using img.save("image.jpg")
from PIL import Image

BLACK = (0,0,0)
WHITE = (255,255,255)
CANVAS_SIZE = 500

zoom = 0.125
offset_x = 0
offset_y = 0

def CheckMandelbrot(point: tuple):
    cx = point[0]
    cy = point[1]
    x = 0
    y = 0
    iteration = 0
    max_iterations = 25
    while(x*x + y*y <= 2*2 and iteration < max_iterations):
        new_x = (x*x) - (y*y) + cx
        y = (2*x*y) + cy
        x = new_x
        iteration += 1
    if(iteration == max_iterations):
        return(BLACK)
    else:
        return(WHITE)

def GenMandelbrotImage():
    pixels = []
    for ix in range(round(CANVAS_SIZE)):
        for iy in range(round(CANVAS_SIZE)):
            pixels.append(CheckMandelbrot((((ix+offset_x)/(CANVAS_SIZE*zoom)),(iy+offset_y)/(CANVAS_SIZE*zoom))))

    img = Image.new("RGB", (CANVAS_SIZE,CANVAS_SIZE))
    img.putdata(pixels)
    img.save("image.jpg")
    print("Image Saved!")

GenMandelbrotImage()
from PIL import Image

BLACK = (0,0,0)
WHITE = (255,255,255)
CANVAS_SIZE = 500

zoom = 0.125
offset_x = -250
offset_y = -250

def CheckMandelbrot(point: tuple):
    cx = point[0]
    cy = point[1]
    x = 0
    y = 0
    iteration = 0
    max_iterations = 25
    while(x*x + y*y <= 2*2 and iteration < max_iterations):
        new_x = (x*x) - (y*y) + cx
        y = (2*x*y) + cy
        x = new_x
        iteration += 1
    if(iteration == max_iterations):
        return(BLACK)
    else:
        color = round(255*iteration/max_iterations)
        if(color > 255):
            color = 255
        return((0,0,color))

def GenMandelbrotImage():
    pixels = []
    for ix in range(round(CANVAS_SIZE)):
        for iy in range(round(CANVAS_SIZE)):
            pixels.append(CheckMandelbrot((((ix+offset_x)/(CANVAS_SIZE*zoom)),(iy+offset_y)/(CANVAS_SIZE*zoom))))

    img = Image.new("RGB", (CANVAS_SIZE,CANVAS_SIZE))
    img.putdata(pixels)
    img.save("image.jpg")
    print("Image Saved!")

GenMandelbrotImage()